Introduction – Operation – Options – PSNR – Histogram – Other settings
Introduction — The Structural Similarity Index (SSIM) is a perceptual metric that quantifies image quality degradation* caused by processing such as data compression or by losses in data transmission. It is a full reference metric that requires two images from the same image capture— a reference image and a processed image. The processed image is typically compressed. It may, for example, be obtained by saving a reference image as a JPEG (at any quality level) then reading it back in. SSIM is best known in the video industry, but has strong applications for still photography. Any image may be used, including those of Imatest test patterns such as Spilled Coins or Log F-Contrast.
| *SSIM actually measures the perceptual difference between two similar images. It cannot judge which of the two is better: that must be inferred from knowing which is the “original” and which has been subjected to additional processing such as data compression. |
Unlike PSNR (Peak Signal-to-Noise Ratio), SSIM is based on visible structures in the image. Although PSNR is no longer regarded as a reliable indicator of image quality degradation it is available as an alternative measurement in the Imatest SSIM module.
The Imatest SSIM calculation is based on the Matlab implementation of the paper, “Image Quality Assessment: From Error Visibility to Structural Similarity”, by Zhou Wang, Alan Bovik, HamidSheikh, and Eero Simoncelli.
| SSIM is also calculated in the Imatest Image processing module, which has many capabilities not present in the SSIM module. For example, it can apply common degradations (noise, blur, flare, etc.) to images then apply signal processing techniques commonly used to enhance images (tone mapping, unsharp mask, bilateral filtering, etc.). |
Operation
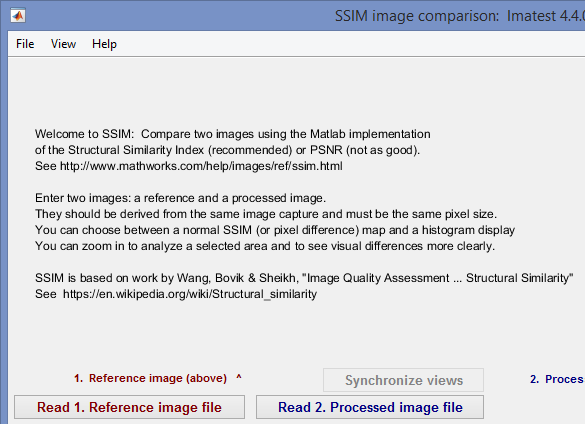
Open Imatest and click on the SSIM button at the bottom of the Utility modules on the right, or click Utility (dropdown menu), SSIM.This opens the SSIM window, which initially displays simplified instructions.
Read in the two images to compare using the Read 1. Processed image file and Read 2. Reference image file buttons. The images
- should be derived from the same source (image capture), i.e., they should have identical scene content. They may be processed differently.
- must have the same pixel size.
The initial results are displayed after the two images have been read in. The example uses a captured image of the Imatest Spilled Coins chart. You can produce direct bitmap images of several test patterns using the Imatest Test Charts module, as described below.
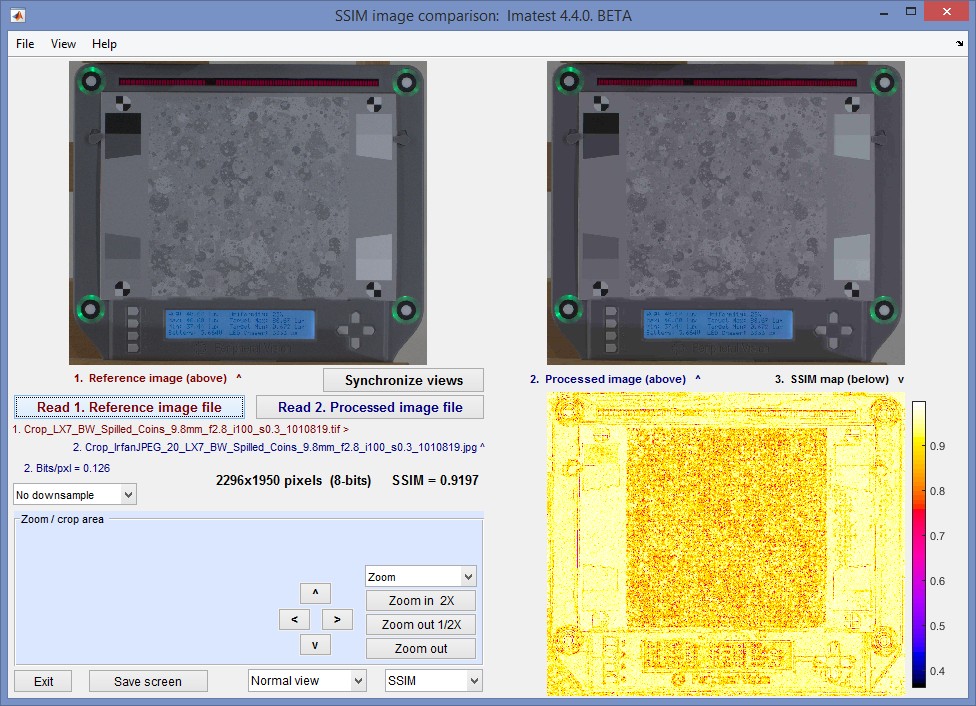 SSIM initial results for a spilled coins image.
Processed image saved with Irfanview at 20% (moderately low) quality
The processed image file is shown on the upper-right. The file name (2. Crop_Irfan…) is shown in dark blue below the images, towards the center. It was saved with an Irfanview quality level of 20 (of 100)— relatively low quality; highly compressed.
The reference image file is shown on the upper-right. The file name (1. Crop LX7…) is shown in brown below the images on the left. Note that SSIM is a symmetrical measurement: results are identical if the processed and reference file images are interchanged.
The SSIM index map (SSIM as a function of location) is shown on the lower-right. Colorbar (Options II) has been selected in the View dropdown menu. The other options are No colorbar (grayscale image) and Grayscale colorbar. A grayscale SSIM map is shown in the Mathworks description of SSIM, but I find it very difficult to interpret.
 The measured compression ratio in Bits/pixel for the processed image (0.126 for this file) is shown on the left below the file names. Bits/pixel is determined by the JPEG quality setting and the image content (compression is reduced, i.e., the ratio is higher, for images with lots of fine detail or noise). This file was saved by Irfanview at quality level 20 (%) (fairly low) to illustrate JPEG quality loss (I would rarely use this compression level in practice; I use 90 for website JPEG images.)
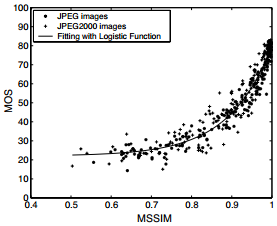
Image size and mean SSIM (for the entire image) are shown near the center of the window. Because SSIM is not very familiar, some explanation is needed. A plot of the mean opinion score (MOS) as a function of mean SSIM (MSSIM) for a large set of images from the Wang, Bovik et. al. paper is shown on the right. The original images were downsampled 2X to account for viewing conditions. Unfortunately the authors don’t give a lot of detail about the meaning of MOS (which seems to be based on a large number of opinions, and normalized to 100). It drops rapidly as MSSIM drops below its maximum value 1 so that there is significant quality degradation at MSSIM = 0.9.
To see the image degradation you generally have to zoom in.
Options
The most important options involve zooming into the image to see the degradation more clearly. There are several ways this can be accomplished.
Zoom / crop
Use a button in the Zoom / crop area (the light blue area on the lower-left). Buttons include Zoom in 2X, Zoom out 1/2X, and Zoom out (to view the full image). The location of the zoom can be set with one of the four direction buttons: <, >, ^, or v. This method can be somewhat clumsy: it may take several clicks to zero in on the desired region.
Select the crop region by clicking and dragging the mouse on any of the images.
| After you’ve made an ROI selection, you need to click on the Synchronize views button near the middle of the window (below the right side of the processed image). |
This updates the cropped SSIM calculation. Here is an example of a cropped image, with the processed image saved at quality 10 (low quality; a bit lower than the above image).
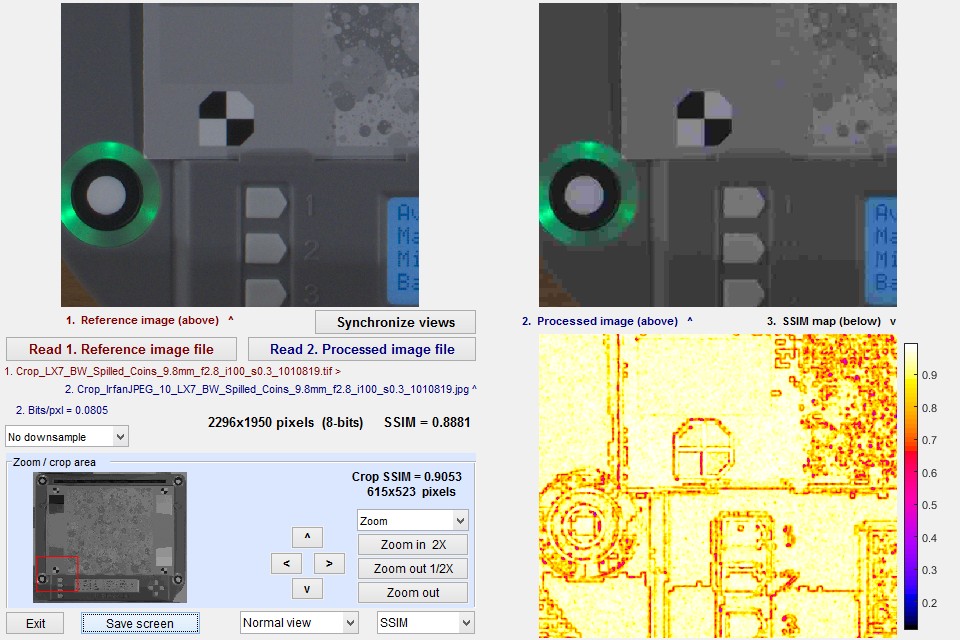 Cropped SSIM results. Processed image saved with Irfanview at 10% (low) quality
Degradation artifacts are clearly visible in the image on the left. SSIM is highest in smooth areas of the image, which show little degradation, and largest at the boundaries of structured features, such as the Isolight LED on the left.
When the image is zoomed (i.e., cropped), the zoomed area is shown inside the red rectangle in the thumbnail image on the lower left, and the SSIM of the crop area is shown on the right of the light blue Zoom / crop area.
PSNR (Peak Signal-to-Noise Ratio)
Although we don’t recommend the use of PSNR (the Wang-Bovik paper has several examples illustrating its poor correlation with perceptual quality), it is still used in some segments of the industry. You can calculate PSNR in the SSIM module (using the Matlab PSNR routine) by making the appropriate selection in the SSIM / PSNR dropdown menu at the bottom of the SSIM window. Note that this selection is not saved. The SSIM module always opens with SSIM selected. When PSNR is selected the image on the lower-right shows the pixel difference (processed minus reference, offset by a middle gray mean pixel level (127)).
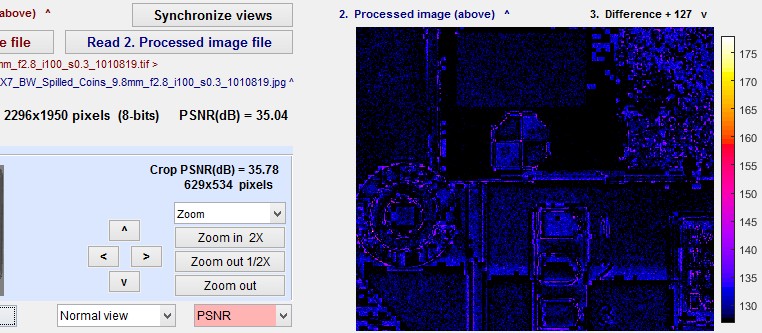 PSNR results (cropped), showing difference map on lower right.
Note that PSNR has units of dB (decibels). The SSIM / PSNR dropdown menu is displayed as pink when PSNR is selected so you don’t accidentally leave the calculation set to PSNR when you want the (recommended) SSIM calculation.
Histogram
You can select a Histogram display for either SSIM or PSNR using the Normal view / Histogram dropdown menu on the bottom of the SSIM window. The Histogram is displayed on the lower-right, replacing the SSIM or pixel difference map. The Histogram is for the crop (if the image is cropped). It can very with image content, i.e., the crop histogram is not necessarily the same as for the whole image. Here is it for the JPEG with (Irfanview) quality 10, shown above. The lower the JPEG quality, the more spread the histogram.
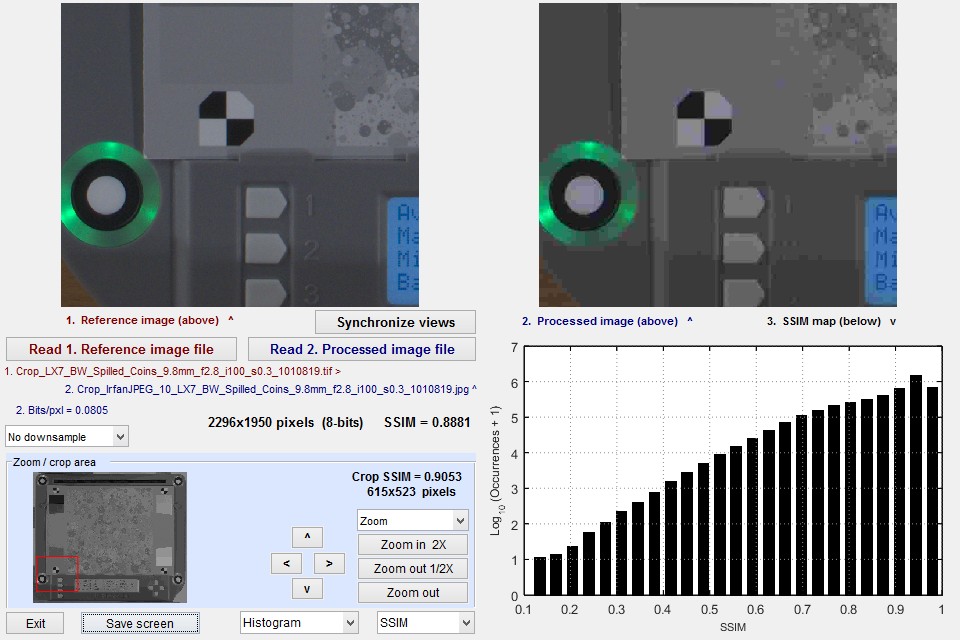 SSIM Histogram. Compare to Cropped SSIM results (above).
Processed image saved with Irfanview at 10% (low) quality
Other settings
The Downsample dropdown menu (on the left, above the Zoom / crop area) lets you downsample (resize down) the image prior to SSIM analysis. When the image is downsampled, results are more representative of perceptual degradation at lower magnifications— what you might see for small image sizes or large viewing distances. SSIM and PSNR numbers are always better for downsampled images. Unlike the Acutance calculation, the SSIM calculation (in its current form) has no clear specification for viewing conditions. This menu was added because Wang-Bovik downsample some of their images prior to analysis.
Creating test images with Imatest Test Charts
You can create images for direct comparison with the Imatest Test charts module (button on the right of the Imatest main window). Here is an example, for the Spilled Coins chart, which is designed to measure the effects of signal processing on texture.
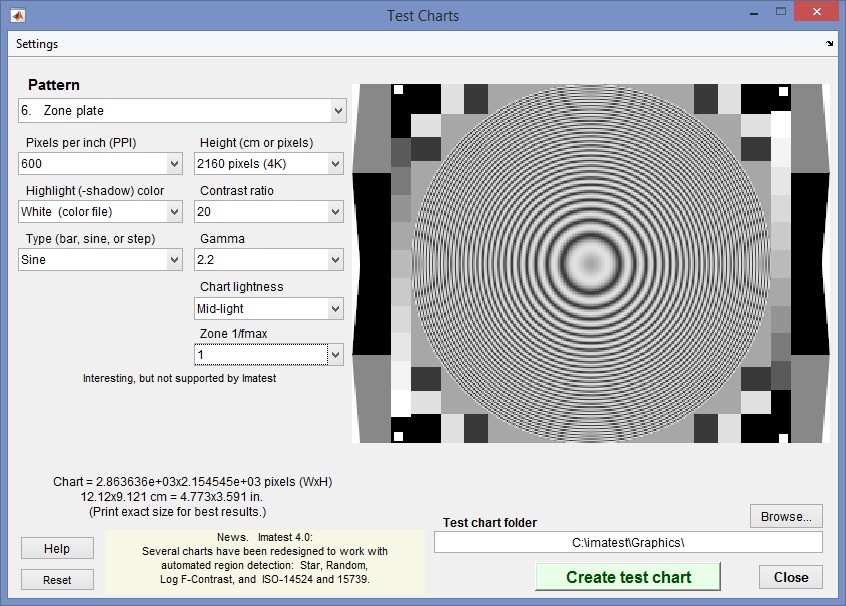 Test Charts Zone plate image. Output set for 4k video resolution.
The Zone plate is one of several chart designs of interest for SSIM analysis. Others are Log Frequency-Contrast, Siemens Star, and Spilled Coins (Random 1/f). Unlike the others, the Zone plate does not have its own analysis module. It is of particular interest because it’s a worst-case image for viewing signal processing artifacts, particularly those caused by aliasing (highly visible in the above preview image, which is different from the final image).


