Introduction
Part 1 of this page illustrates images analyzed in Random Scale-invariant & Dead Leaves. The images are not shown original size; they’ve been resized to be approximately equal in magnification with respect to the original chart image— with enough magnification to show the results of the camera optics and image processing.
Part 2 demonstrates how demosaicing is the cause of a commonly observed discrepancy between Spilled Coins and slanted-edge MTF measurements.
Part 1: Images used in Random / Dead Leaves
| Camera phone MTF from Spilled Coins pattern (looks pretty good, but…)Here is the Spilled Coins MTF from the 8MP Camera phone. Results are pretty good, but the high frequency energy is from artifacts around edges: it is not representative of true texture detail. It would seem from this image that the Random Scale-Invariant chart might produce results that are more representative of the texture blur. | 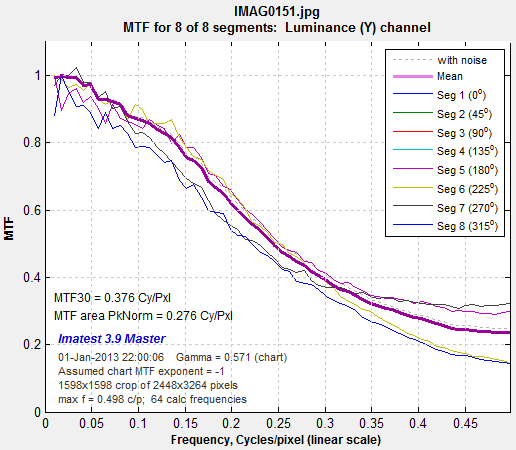 Camera phone MTF from Spilled Coins pattern |
| Camera phone MTF from slanted-edge. Flunnks badlyHere are the results from the slanted-edge at the bottom of the image. Results are quite poor, as expected, with little meaningful energy above 0.3 C/P. It’s a good bet that this ill-behaved camera was not included in the tests that established strong correlation from Dead Leaves-derived MTF and perceptual image quality. | 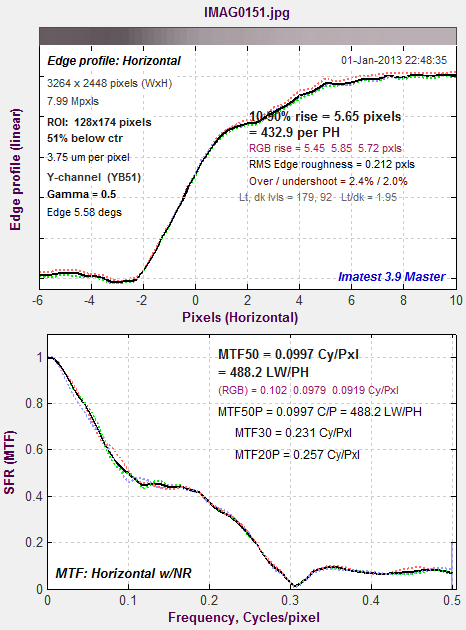 Camera phone MTF from slanted-edge. |
Part 2: Spilled Coins vs. Slanted edge MTF
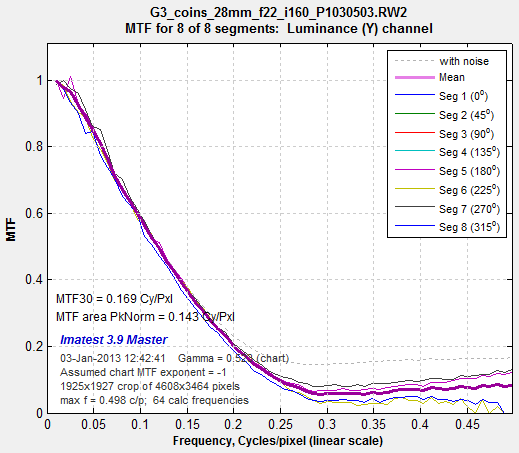
When MTF results are compared for the Spilled Coins pattern and slanted edges from the same image, we often see a discrepancy at high spatial frequencies— typically above 0.3 or 0.4 cycles/pixel, depending on the image. The Spilled Coins MTF has a floor, i.e., it doesn’t drop below a minimum value as spatial frequency increases, while the slanted-edge MTF continues to drop into the noise. We have found that this result is primarily caused by demosaicing, which involves nonlinear processing that treats edges (in the Spilled Coins pattern) differently from noise (in the smooth areas on the sides of the Spilled Coins pattern).
| Summary: We have found that discrepancies between Spilled Coins and slanted-edge MTF measurements are primarily caused by demosaicing, which is a type of nonlinear processing that handles edges and random noise quite differently. |
Spilled Coins MTF |
Slanted-edge MTF |
| Demosaiced First, we analyze a demosaiced image taken at f/22 that doesn’t have much high frequency energy. this makes it useful for looking at a single color plane of an undemosaiced image (shown below).
Spilled Coins MTF, demosaiced, f/22, ISO 160 Agreement between the two methods is excellent below 0.25 C/P, but they diverge at higher spatial frequencies. Similar results are observed at ISO 800, but curves are rougher. |
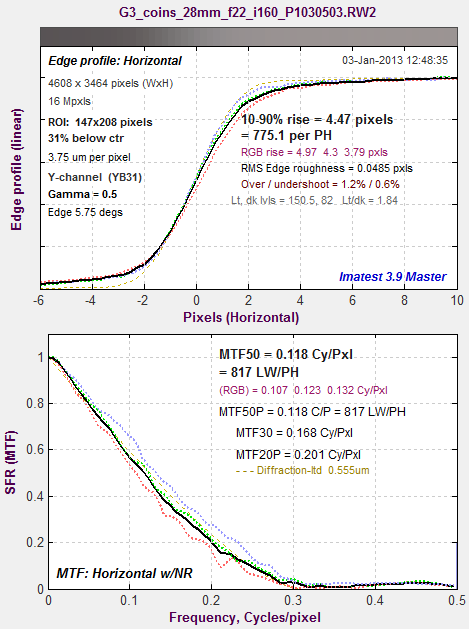 Slanted-edge MTF, demosaiced, f/22, ISO 160 |
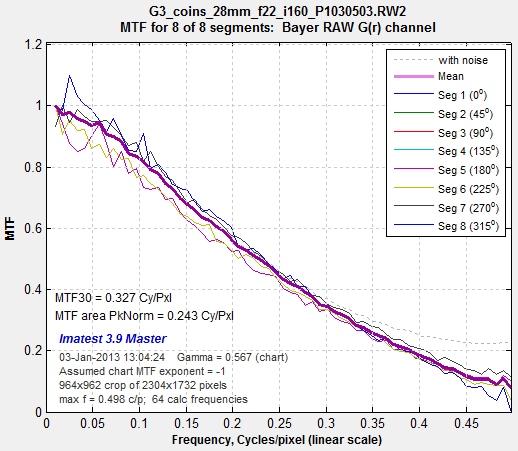
| No demosaicing Next, we analyze a single color plane of the same image, undemosaiced. The number of vertical and horizontal pixels are half that of the standard demosaiced image, and the pixel pitch is double. Hence the frequencies are approximately doubled for this curve, e.g., MTF @ 0.4 C/P undemosaiced ˜ MTF @ 0.2 C/P demosaiced.
Spilled Coins MTF, demosaiced, f/22, ISO 160 Agreement between the two methods is excellent. |
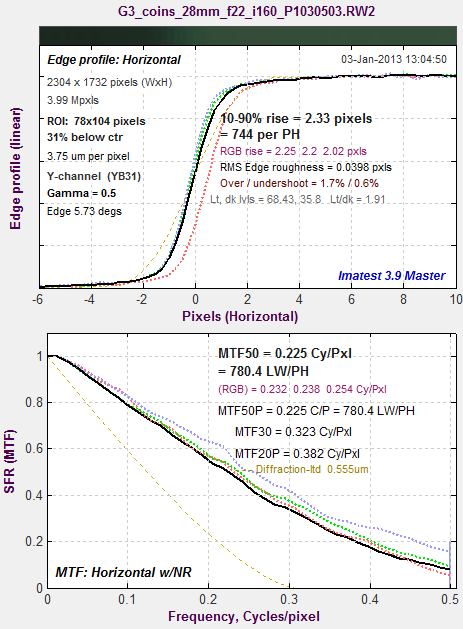 Slanted-edge MTF, undemosaiced, f/22, ISO 160 Slanted-edge MTF, undemosaiced, f/22, ISO 160 |
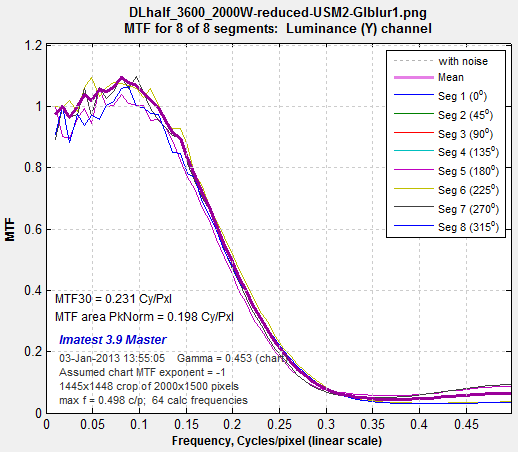
| No demosaicing Finally, we analyze an image that has not been passed through a camera. It is an original image used to create the Spilled coins chart that has been reduced, linearly sharpened (USM R=2), and linearly blurred (gaussian R=1). By linear we mean perfectly uniform processing with no thresholds.
Spilled Coins MTF, original image reduced, USM sharpened (R=2), blurred (gaussian R=1) Agreement between the Spilled Coins and slanted-edge pattern is nearly perfect. |
|






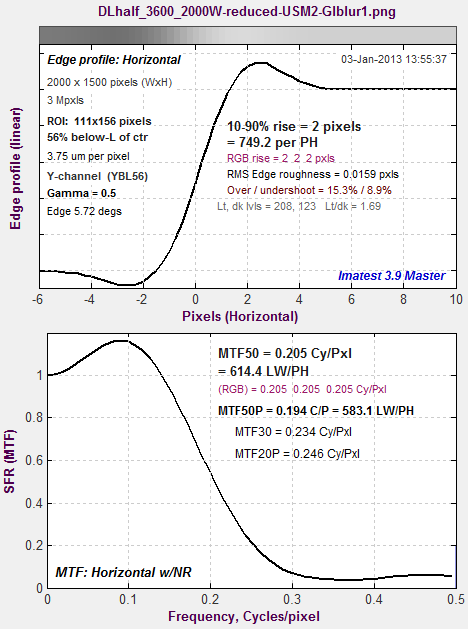 Slanted-edge MTF, original image reduced, USM sharpened (R=2), blurred (gaussian R=1)