| Standard: | ISO 17957 — Shading measurements |
| Technical Committee: | ISO/TC 42 Photography |
| Published: | 2016-04-01 |
| Image Quality Factor: | Uniformity |
ISO 17957 was implemented in the Imatest Uniformity and Uniformity Interactive (UI) modules, starting with Imatest 2020.2. Uniformity measurements can also be accessed from Blemish Detect. All of these modules analyze flat-field images.
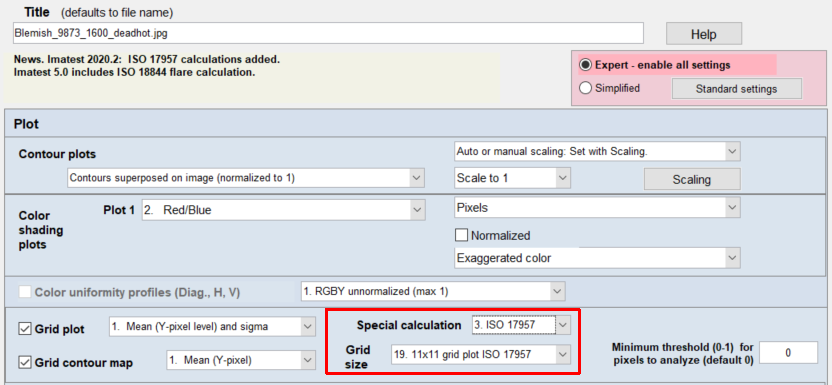
To obtain ISO 17957 calculations from Uniformity or UI, Special calculation (which can also be set to none or CPIQ) should be set to ISO 17957 and Grid size should be set to 11x11, as shown below in the Settings (or More settings) window. Click OK at the bottom of the window (not shown) to proceed with the run.
 Portion of Settings window for Uniformity or Uniformity Interactive (UI)
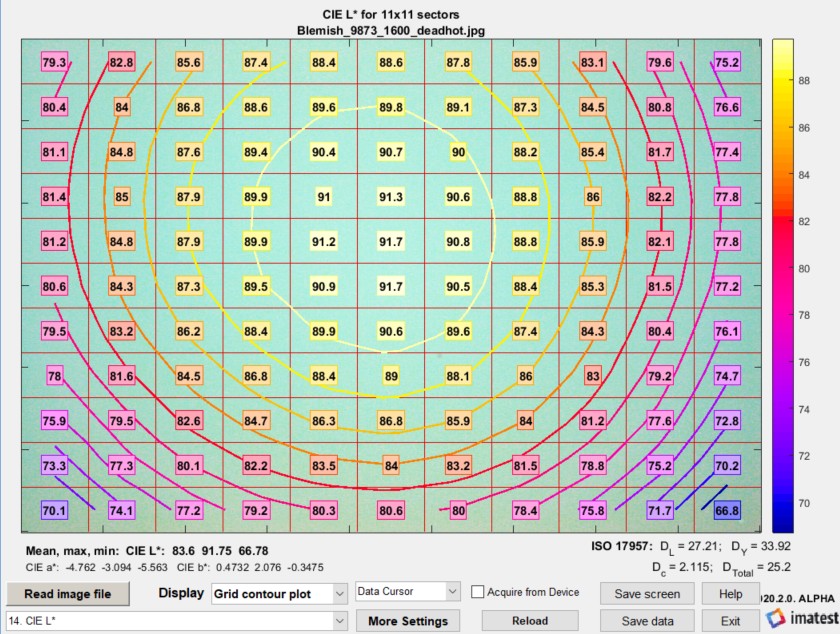
After Uniformity or UI has been run, results are available in the Grid plot or new Grid contour map. Here is an example of the Grid contour map, which is particularly nice for visualizing results. We have selected L* (one of many selections available).
 Grid contour map for L* in Uniformity Interactive.
ISO 17957 results are shown on the right, below the image.
ISO17957:2015 requires that "Exposure shall be adjusted to give an average output value of the central measurement block, between 110 and 130 in sRGB encoding values, when exposure adjustment is available". This requirement can technically only be met when testing 8-bit per channel sRGB images, but Imatest software will produce the mean values for other data formats as well. If the specified 11x11 grid is selected, the mean RGB values are provided in the "RGB_center_mean" json field for convenience. Otherwise this field is populated with NaNs.
The complete results as illustrated in Appendix B.2 of the standard are in the JSON output tile. We show a portion here.
"iso_17957": {
	"comment1": "The following results are displayed when ISO 17957 is selected.",
	"comment2": "They follow Annex B of the ISO 17957 Standard.",
	"comment3": "RGB values are in sRGB color space (sRGB is specified in ISO 17957).",
	"grid": {
		"Red_mean": [
			[188.2,197.1,204.7,209.7,212.7,213.3,211,205.7,198.1,188.9,176.2],
			:
			[165.9,177,185.6,191.5,194.2,195.1,193.5,189.1,181.7,170.7,157.8]
		],
		"Green_mean": [
			[198.8,208.7,216.5,221.6,224.4,224.9,222.7,217.6,209.7,199.6,187.9],
			:
			[173.2,184.1,192.3,197.9,200.9,201.9,200,195.6,188.5,177.5,164.1]
		],
		"Blue_mean": [
			[196,205.2,212.9,217.8,220.6,221.2,218.9,213.9,206.1,196.5,184.5],
			:
			[167.9,178.3,186.7,192.5,195.2,196.3,194.6,190.4,183.2,172.3,159.6]
		],
		"CIE_X": [
			[0.5112,0.5682,0.6178,0.6513,0.6713,0.6751,0.6596,0.6245,0.5744,0.5154,0.4462],
			:
			[0.3776,0.4337,0.48,0.5134,0.5304,0.5363,0.5258,0.4999,0.4587,0.4003,0.3365]
		],
		"CIE_Y": [
			[0.5112,0.5682,0.6178,0.6513,0.6713,0.6751,0.6596,0.6245,0.5744,0.5154,0.4462],
			:
			[0.3776,0.4337,0.48,0.5134,0.5304,0.5363,0.5258,0.4999,0.4587,0.4003,0.3365]
		],
		"CIE_Z": [
			[0.5112,0.5682,0.6178,0.6513,0.6713,0.6751,0.6596,0.6245,0.5744,0.5154,0.4462],
			:
			[0.3776,0.4337,0.48,0.5134,0.5304,0.5363,0.5258,0.4999,0.4587,0.4003,0.3365]
		],
		"CIE_L": [
			[79.3,82.78,85.55,87.36,88.37,88.56,87.77,85.93,83.15,79.57,75.24],
			:
			[70.1,74.13,77.15,79.22,80.28,80.64,79.97,78.37,75.76,71.72,66.78]
		],
		"CIE_a": [
			[79.3,82.78,85.55,87.36,88.37,88.56,87.77,85.93,83.15,79.57,75.24],
			:
			[70.1,74.13,77.15,79.22,80.28,80.64,79.97,78.37,75.76,71.72,66.78]
		],
		"CIE_b": [
			[79.3,82.78,85.55,87.36,88.37,88.56,87.77,85.93,83.15,79.57,75.24],
			:
			[70.1,74.13,77.15,79.22,80.28,80.64,79.97,78.37,75.76,71.72,66.78]
		],
		"D_ci_chrominance_deviation": [
			[0.6826,0.2253,0.1792,0.0568,0.167,0.1954,0.1524,0.1124,0.1408,0.5855,0.2179],
			:
			[1.79,2.011,2.08,2.114,2.097,2.067,2.115,2.066,1.977,1.944,1.973]
		]
	},
	"RGB_grid_mean": [199.2,211.2,207.4],
	"RGB_center_mean": [220.9,234,230.7],
	"Lab_grid_mean": [83.6,-4.762,0.4732],
	"Lab_grid_max": [91.75,-3.094,2.076],
	"Lab_grid_min": [66.78,-5.563,-0.3475],
	"D_L_Lightness_nonuniformity": [27.21],
	"D_Y_Luminance_nonuniformity": [33.92],
	"D_c_Chrominance_nonuniformity": [2.115],
	"D_Total_Colour_nonuniformity": [25.2]
},
Summary results-only are in the CSV output file.
| The following results are displayed when ISO 17957 is selected. | |||
| They follow Annex B of the ISO 17957 Standard. | |||
| RGB values are in sRGB color space (sRGB is specified in ISO 17957). | |||
| Full results (big arrays) are in the JSON output. | |||
| RGB_Average | 199.17 | 211.18 | 207.37 |
| Lab_Average | 83.6 | -4.76 | 0.47 |
| Lab_Max | 91.75 | -3.09 | 2.08 |
| Lab_Min | 66.78 | -5.56 | -0.35 |
| D_L_Lightness_nonuniformity | 27.21 | ||
| D_Y_Luminance_nonuniformity | 33.92 | ||
| D_c_Chrominance_nonuniformity | 2.11 | ||
| D_Total_Colour_nonuniformity | 25.2 | ||
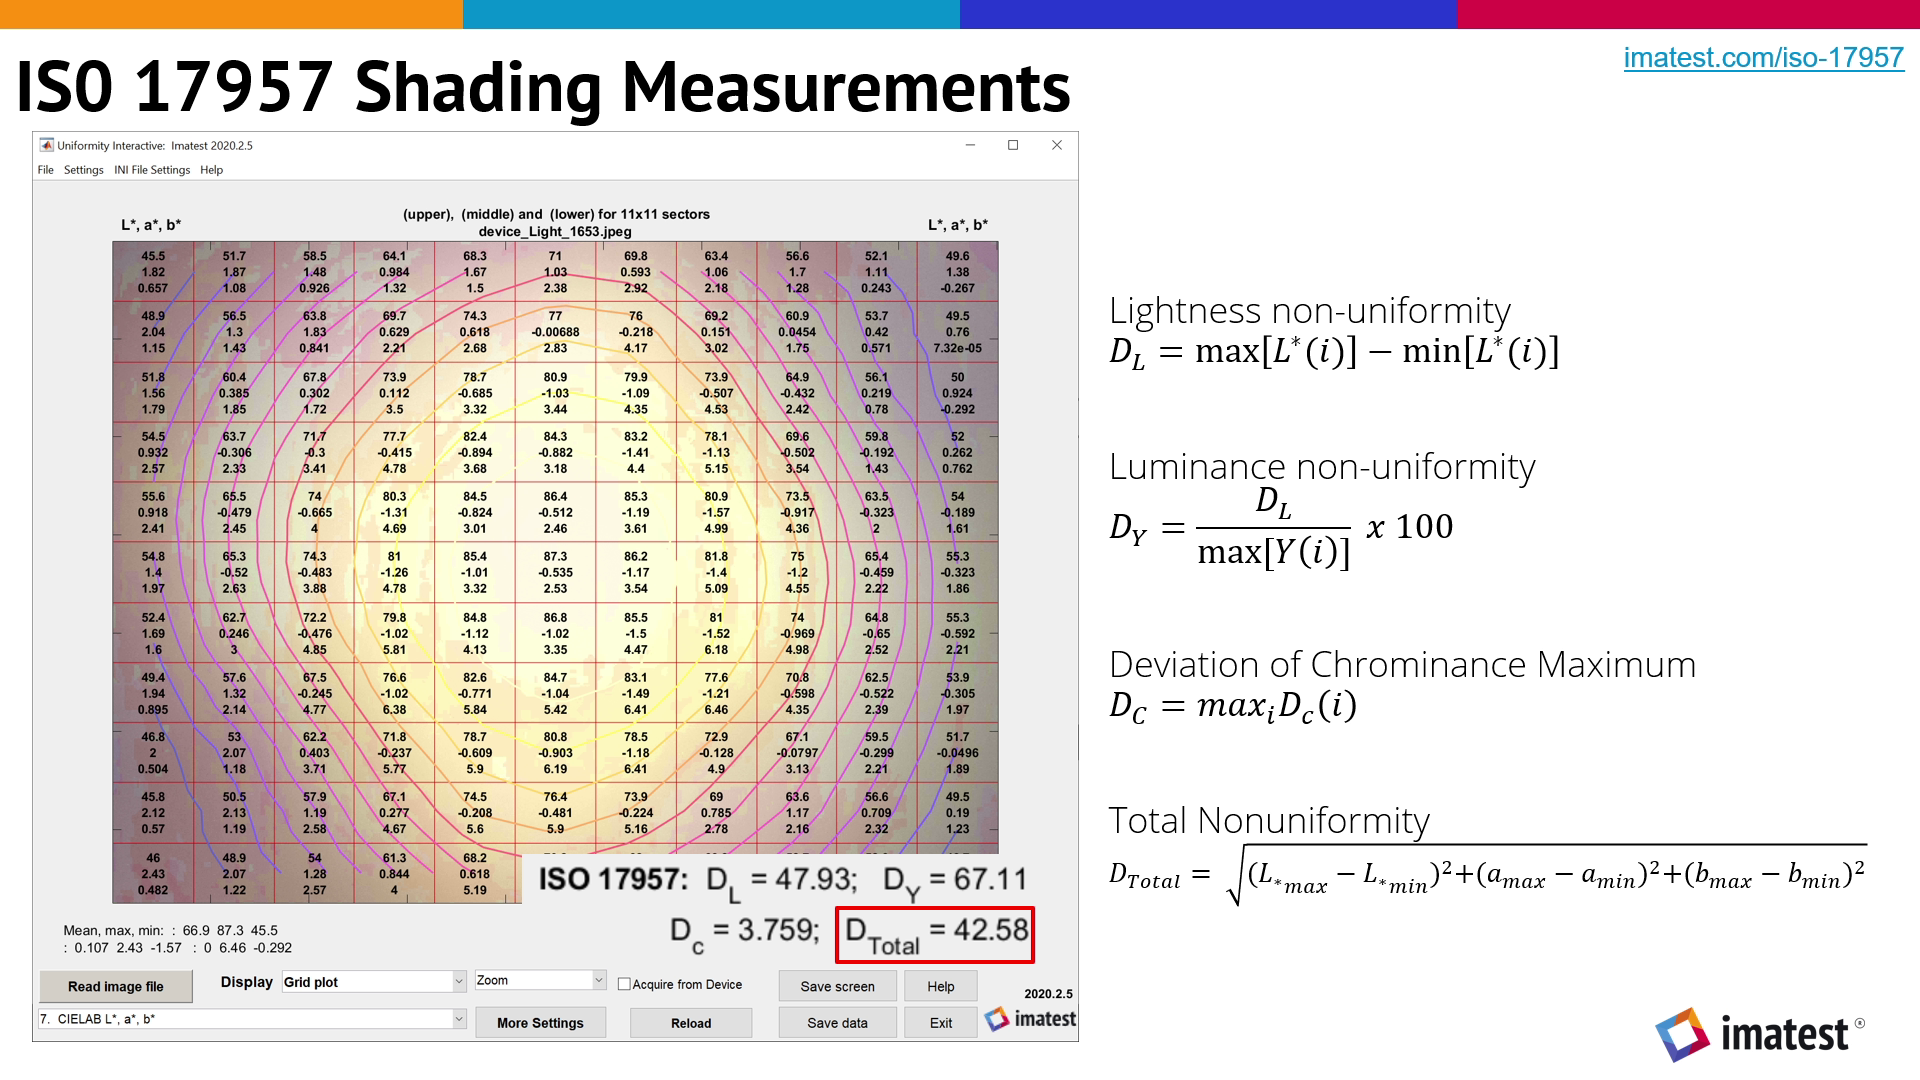
Equations
\(\displaystyle \text{Lightness nonuniformity} = D_L = \max[L^*(i)]-\min[L^*(i)]\)
\(\displaystyle \text{Luminance nonuniformity} = D_Y = \frac{\max[Y(i)]-\min[Y(i)]}{\max[Y(i)]} \times 100\%\)
\(\displaystyle \text{Chrominance deviation for region } i = D_c(i) = \sqrt{[a^*(i)-\text{mean}(a^*)]^2 + [b^*(i)-\text{mean}(b^*)]^2}\)
\(\displaystyle \text{Chrominance nonuniformity} = D_c = \max[D_C(i)]\)
\(\displaystyle \text{Total color nonuniformity} = D_{Total} = \sqrt{(L^*_{\max}-L^*_{\min})^2 + (a^*_{\max}-a^*_{\min})^2 + (b^*_{\max}-b^*_{\min})^2]^2}\)

